









Stop Sweating the IoT Backend: A Friendly Guide to Connecting Devices and Watching Your Data Like a Hawk
You know that moment when you finally get a temperature sensor to blink its little LED, but then you think, “Now what? How does this thing talk to a database and show me a pretty graph?” You’re not alone. The backend side of IoT trips up more folks than a badly crimped wire. I’ve spent countless late nights figuring this out, and I’m here to share the real-world path — no jargon overload — so you can set up your own iot data monitoring system without wanting to throw your Raspberry Pi out the window.
Let’s imagine you’re building a small fleet of soil moisture sensors for a greenhouse. Each device reads analog values, but that data is useless if it stays on the chip. The first big decision is your iot backend system setup. Most people go with a cloud platform because it’s flexible and you don’t have to maintain a server in your basement. The iot cloud backend architecture typically uses managed services: think AWS IoT Core, Azure IoT Hub, or even a lightweight MQTT broker like Mosquitto running on a $5 VPS. Here’s the thing: don’t overcomplicate it. Start small. I usually spin up an MQTT broker and a Node.js app on a cloud VM, then later scale out if needed. That’s your foundation.
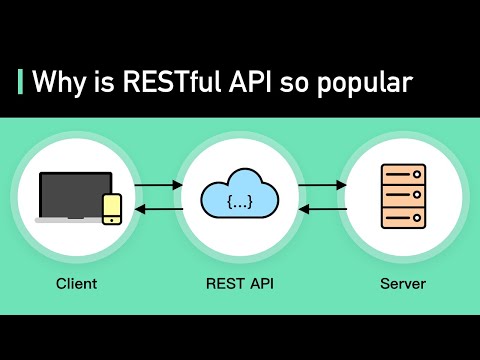
Now, the fun part: how to integrate iot devices with backend. Your devices need a protocol. MQTT is the sweetheart of IoT because it’s lightweight and works over spotty connections. ESP32 boards love it. The device publishes telemetry to a topic — say, greenhouse/sensor1/moisture — and the backend listens. This is exactly where iot backend api integration becomes your friend. You can expose a REST API for devices that prefer HTTP, but for real-time stuff, I stick with MQTT and then use a backend service to push data into a time-series database like InfluxDB or TimescaleDB. A common iot backend integration tutorial would show you how to write a small bridge script in Python that subscribes to MQTT messages, maybe does a little data normalization, and then inserts them. That script is the glue.
But what about iot data collection methods? We usually talk about three flavors: batch (the device stores data and uploads periodically), real-time streaming (push every reading as it happens), and edge-side preprocessing where you aggregate on the device first. If your greenhouse is remote with flaky 2G, batching wins. For water leak detectors in a factory, you want real-time streaming. I often combine them: the device streams raw data, and an edge gateway can smooth it before it hits the cloud. This keeps your iot cloud backend architecture from being flooded with noise.
Once data flows in, you’ll want to know how to monitor iot data without building a dashboard from scratch. An iot data monitoring system is more than just a live feed; it’s about alerts, history, and spotting anomalies before your plants wilt. I set up rules in the backend — “If moisture drops below 30% for 5 minutes, send a Telegram alert.” Simple cron jobs or a stream processing framework like Apache NiFi or even a Node-RED flow can handle that. Real time iot data monitoring gives you that heartbeat view: you glance at a screen and see the current soil moisture blip every second. WebSocket connections from the backend to a web dashboard make it feel instantaneous. When you see the line dip on a graph as the sprinkler kicks in, it’s weirdly satisfying.
And that brings us to iot data visualization tools. You don’t need to hire a UX wizard. Grafana is the undisputed champion for IoT dashboards. It connects to practically any time-series database, and you can create panels with gauges, sparklines, and even geomaps. I’ve built dashboards that look so good my non-techie friends thought I launched a startup. Another favorite is ThingsBoard, which gives you a full iot data monitoring system out of the box — device management, dashboards, alarm rules, all in one. If you’re allergic to setup, it’s a lifesaver. Pair it with MQTT integration and you’ll have devices talking to a polished interface in an afternoon.
Now, a story: A buddy of mine was monitoring bee hive temperature with a bunch of ESP8266s. He followed a typical iot backend integration tutorial, got the MQTT broker running, but his data was arriving as raw bytes and looked like gibberish. The problem was he skipped the step of defining a clear API schema. When you set up your iot backend api integration, decide on a JSON format early. Something like {"device_id": "hive1", "temp_c": 34.5, "humidity": 68, "ts": 1710000000}. Every single device sends that exact shape. It saves hours of head-scratching later when you try to fill a dashboard and the fields don’t match. This also makes it dead simple to write ingestion scripts, no matter which iot data collection methods you choose.
You might be wondering about security. Don’t skip TLS and device authentication, even for a hobby project. Most cloud platforms offer X.509 certificates or token-based auth out of the box. When I do iot backend system setup for a serious deployment, I create unique credentials per device and use network isolation. A misconfigured device shouldn’t open your whole VPS to the internet. If you’re feeling bold, run a small VPN like Tailscale and have devices connect through that. Yes, it’s extra steps, but your iot data monitoring system will thank you when it’s not spewing false readings from a hacked sensor.
One more overlooked piece: storage strategy. People think they can hoard every data point forever, then a month later their database is crying. In a real iot cloud backend architecture, you’ll want rollups. Keep raw data for maybe a week, then downsample to 5-minute averages for longer retention. Querying a year of millisecond data for a daily soil moisture trend is overkill and slow. Automate this with retention policies in InfluxDB or a scheduled function in your backend. It’s a quiet hero of any solid iot data monitoring system.
Finally, treat your backend as a living thing. Start simple — an MQTT broker, a Python script that listens and stuffs data into InfluxDB, then Grafana on top. That trio has taught me more than any paid course. As you get comfortable, you can swap pieces: maybe you’ll replace the script with a proper stream processor, or switch from InfluxDB to TimescaleDB for SQL convenience. The beauty is, once you grasp how to integrate iot devices with backend and build that pipeline, the rest is just scaling up. The real joy hits when you refresh a dashboard and see your plants are happy, or your smart office lights dim right on schedule — and you built all that yourself.
So go grab a microcontroller, set up that backend, and start streaming. The stack you cobble together today might just become the blueprint for your next big automation project. And if you get stuck, remember: every single person who built a fancy iot data visualization tool started with a blinking LED and a messy JSON payload. You’re in good company.